Safety Management Systems: they seem complicated. But Aviation Maintenance Magazine is aiming to make them simple to implement.
In the January issue, we examined some hazard identification strategies. Because of Covid-19, we diverged from our expected series to bring you news about Covid-19 legislation in the March issue. But now we’re back to SMS(!) and this month, we’ll begin looking at the process of using risk assessment to analyze our identified hazards. If you don’t remember how to identify hazards, then look back at the January issue to refresh your memory (it is available online).
The point of identifying hazards is to identify the things that could go wrong in your system. In the January issue, we suggested documenting hazards in a centralized and comprehensive hazard log. We specifically recommended using a database. A database will allow you to analyze trends in hazards, reference the mitigations associated with each hazard, and even serve as a tool for change management (we will address all of these in future articles). Before we can start tying our hazards to mitigations, though, we are going to first examine how to assess the risk posed by each hazard.
We assess risk for a number of reasons.
One reason for assessing risk is to better allocate limited resources. If you know that you have three hazards that you could mitigate, but you can only mitigate then one at a time, then having a mechanism for deciding which hazard is most important to address would help you to decide how to allocate your resources.
A second reason for assessing risk is to decide when you have done a sufficient job in reducing the risks posed by the hazard. By assessing risk, you can set a metric for when risks are considered to be adequately contained. This tells you, prima facie, when a mitigation is considered to be “good enough.”
A third reason for assessing risk is to permit the system to engage in constant improvement. If you assess the risk levels posed by a set of hazards, then you can mitigate the risks to the acceptable level that has been set by the company. Once the known hazards have all been mitigated to the acceptable level, the company can decide to pursue a higher level of safety by changing the acceptable level of risk! For example, if you create a system that assigns risk values to hazards, and you successfully build a system that mitigates all of the hazard-based risks to a value of 10 or less, then after achieving that goals, you might next seek to mitigate the risks valued at 9 and 10 to a value of eight or less.
A fourth reason for assessing risk is to have a mechanism for judging your company’s progress on the safety continuum. By assessing and assigning numerical risk values to each hazard, you have an opportunity to record and assess the progress your company is making on its path toward safety. You can set risk-based goals (“performance indicators”) like reducing every risk below a certain metric or reducing the average of all risks in a system below a metric.
So what does it mean to assess risk?
We typically assess risk In an SMS system by assigning two values to each hazard. The first value is “likelihood,” and the second value (which we’ll examine in next month’s article) is consequence. Together, they can provide a measure of the risk posed by a particular hazard.
Likelihood reflects the prospect that the hazard condition will manifest itself. The purpose of this assignment is to rank more likely occurrences higher than less likely occurrences. Therefore it is typically not an absolute measure of probability. The values used may vary based on the system, and the needs of the system. For example, in a manufacturing environment, you might assess likelihood values related to failures of the manufactured product based on probability of hazard occurrence per operational hour. In the FAA Certification system, a likelihood measured at one occurrence in less than 100,000 hours of operation is considered to be probable; while a likelihood measured at one occurrence in more than 1,000,000,000 hours of operation is deemed to be extremely improbable. These two metrics reflect the bookends of the likelihood range in an FAA certification project. The United States military uses safety management and deems a hazard to be probable if it will occur several times in a system, but has another value – frequent – which describes hazards that are likely to occur frequently in the life of a system. In other systems, the values may distinguish hazards that will certainly arise in the life of a system (100% chance) from those that are expected but may not arise 100% of the time, to those that are remote in the sense that they have not yet arisen but are nonetheless feasible.
The scale that you use should be tailored to the particular hazards in your system, and the best factors that will provide you with meaningful distinctions to permit useful differentiation among the hazards being analyzed. For example, FAA certification distinctions may not be appropriate for a repair station, because the repair station may want to identify hazards that happen every day and distinguish them from those that happen once per week and distinguish those from hazards that arise once per month. All three categories likely fall into the “probable” likelihood on the FAA certification scale but if they all fall into the same category then the likelihood metric is not being successfully used to distinguish them.
In a repair station environment, you will encounter hazards such as human factors issues that arise on a more regular basis than the basis described in the FAA Certification probabilities, so the FAA Certification range probably does not provide the appropriate metrics for judging the likelihood of hazards in a repair station. For purposes of this article, we shall use the rating scale in the chart above as our likelihood values.
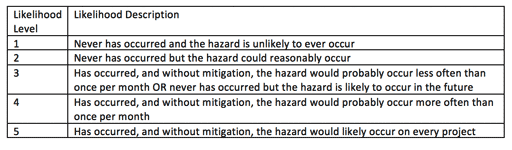
Notice that these values are based on narrative descriptions, rather than hard numerical probabilities. This is because the typical repair station may be unable to classify its hazards based on strict numerical probabilities. A repair station will also have to consider the scope of the narrative descriptions (which may be based in part on the sources of hazard data). For example, if you are examining the failure of a particular OEM part, then the repair station’s experience may suggest it is a level 2 likelihood (“never has occurred but the hazard could reasonably occur”); but expanding the scope to include data from other repair stations might shift it to level 3 (“has occurred, and without mitigation, the hazard would probably occur less often than once per month OR never has occurred but the hazard is likely to occur in the future”).
Let’s say that the hazard in question is the release without final inspection of a unit that was subject to overhaul procedures. Let’s also say that this hazard is identified because it occurred in the facility. Because it actually happened, this automatically gives it a level 3,4, or 5 likelihood (based on the definitions, above). It might be assigned a risk level based on past experience (if this has happened before, then the prior occurrence experience might help assign a likelihood level) or based on the intuition of the inspector responsible for the assignment. In this scenario, there is no precise answer, and therefore it makes sense to have one person or one group assessing the likelihood level in order to ensure risk assignments follow a reasonably standard pattern (so you do not have radically different risk assignments based upon different opinions of the narrative descriptions).
Because different people can come up with differing opinions about likelihood, a more objective standard can be valuable (so please do not assume that the likelihood values in the above table reflect an ideal). When you are establishing likelihood values and narratives, don’t be afraid to adjust them to suit the needs of your business (including the need to distinguish more-likely events from less-likely events). If you do adjust your values, though, then you may need to re-analyze past risk assessments to update them to the new standard so you can compare hazards according to the same metrics.
The table on the previous page includes four different levels. Your table may include more or less levels. The important thing is that the table you develop for your own system must distinguish among hazards in a way that is useful to your analysis of those hazards.
Your likelihood assessments should permit you to distinguish hazards based upon the difference in the likelihood. If likelihood was the only metric that you used, then this would permit you to focus first on the most likely hazards, and then save the less likely hazards to be mitigated later.
Likelihood is not the only metric we typically use to assess risk. Next month, we will examine the metric known as “consequence,” which will help us to distinguish the most damaging hazards from the less damaging hazards. Using likelihood and consequence together, we will be able to judge which hazards pose a greater risk to safety.
Part III of SMS Series Next Issue
In the next issue, we’ll look at the process of using “consequence” as part of our risk assessment, and we will examine how to examine our identified hazards in a risk assessment environment. Want to learn more? We’ve been teaching classes in SMS elements, and we’ve advised aviation companies in multiple sectors on the development of SMS processes and systems. Give us a call or send us an email if we can help you with your SMS questions.